Summarize:www.chinabuses.org:
Part Three: Analysis of Above 6-meter CNG Buses’ Prices & Sales in Jan. - Feb. 2012
Table Three: Statistic of Above 6-meter CNG Buses’ Prices & Sales in Jan. - Feb. 2012
|
|
¥0.2~0.3 million
|
¥0.3~0.4 million
|
¥0.4~0.5 million
|
¥0.5~0.6 million
|
Above¥0.6 million
|
|
Sales Volume
|
213
|
371
|
358
|
126
|
46
|
|
Market Share
|
19.1
|
33.3
|
32.1
|
11.3
|
4.2
|

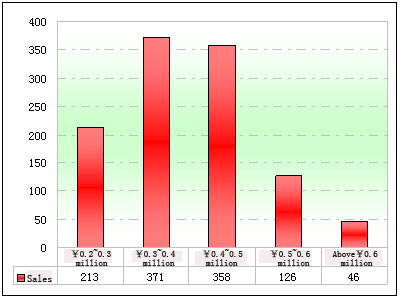
Chart Three: Statistic of Above 6-meter CNG Buses’ Prices & Sales in Jan. - Feb. 2012
From the above data, it is seen that
1. In Jan. - Feb. 2012, the sales of the CNG buses in the prices of ¥0.2~0.3 million and¥0.3~0.4 million are the two main ones in CNG bus market. These two sales volume account nearly one third of the total sales of CNG bus. However, the other prices buses' sales are rather small, which shows the market phenomenon- small at both ends and big in the middle.
The market share of the small CNG buses is now decreasing and the large luxurious of CNG buses is now increasing. For the medium CNG buses, its market share is relatively stable, which provides the CNG bus builders more important quantitative basis for the future production and sales of the CNG buses.
Part Four: Statistic of CNG Buses’ Sales in China’s Different Regional Markets in Jan. - Feb. 2012
1. CNG Buses’ Sales in China’s Northeast Regional Markets
Table Four: Statistic of CNG Buses’ Sales in China’s Northeast Regional Markets in Jan. - Feb. 2012
|
|
Large CNG Buses
|
Medium CNG Buses
|
Small CNG Buses
|
Total
|
|
Liaoning
|
3
|
2
|
2
|
7
|
|
Jilin
|
29
|
48
|
2
|
79
|
|
Heilongjiang
|
16
|
4
|
0
|
20
|
|
Total
|
48
|
54
|
4
|
106
|
2. CNG Buses’ Sales in North China Regional Markets
Table Five: Statistic of CNG Buses’ Sales in North China Regional Markets in Jan. - Feb. 2012
|
|
Large CNG Buses
|
Medium CNG Buses
|
Small CNG Buses
|
Total
|
|
Beijing
|
8
|
3
|
2
|
13
|
|
Hebei
|
2
|
16
|
9
|
27
|
|
Inner Mongolia
|
1
|
2
|
1
|
4
|
|
Shanxi
|
67
|
4
|
2
|
73
|
|
Tianjin
|
2
|
2
|
0
|
4
|
|
Total
|
80
|
27
|
14
|
121
|
3. CNG Buses’ Sales in East China Regional Markets
Table Six: Statistic of CNG Buses’ Sales in East China Regional Markets in Jan. - Feb. 2012
|
|
Large CNG Buses
|
Medium CNG Buses
|
Small CNG Buses
|
Total
|
|
Anhui
|
32
|
2
|
3
|
37
|
|
Jiangsu
|
11
|
6
|
2
|
19
|
|
Jiangxi
|
2
|
7
|
1
|
10
|
|
Shandong
|
9
|
17
|
4
|
30
|
|
Fujian
|
0
|
2
|
1
|
3
|
|
Shanghai
|
1
|
1
|
0
|
2
|
|
Zhejiang
|
40
|
25
|
2
|
67
|
|
Total
|
95
|
60
|
13
|
168
|
4. CNG Buses’ Sales in North-west China Regional Markets
Table Seven: Statistic of CNG Buses’ Sales in North-west China Regional Markets in Jan. - Feb. 2012
|
|
Large CNG Buses
|
Medium CNG Buses
|
Small CNG Buses
|
Total
|
|
Xingjiang
|
39
|
20
|
28
|
87
|
|
Shaanxi
|
5
|
12
|
7
|
24
|
|
Gansu
|
0
|
6
|
2
|
8
|
|
Ningxia
|
0
|
4
|
0
|
4
|
|
Qinghai
|
2
|
1
|
1
|
4
|
|
Total
|
46
|
43
|
38
|
127
|
5. CNG Buses’ Sales in Southwest China Regional Markets
Table Eight: Statistic of CNG Buses’ Sales in Southwest China Regional Markets in Jan. - Feb. 2012
|
|
Large CNG Buses
|
Medium CNG Buses
|
Small CNG Buses
|
Total
|
|
Sichuan
|
40
|
214
|
93
|
347
|
|
Chongqing
|
5
|
48
|
31
|
84
|
|
Yunnan
|
3
|
6
|
7
|
16
|
|
Guizhou
|
2
|
3
|
2
|
7
|
|
Total
|
50
|
271
|
133
|
454
|
6. CNG Buses’ Sales in Central South China Regional Markets
Table Eight: Statistic of CNG Buses’ Sales in Central South China Regional Markets in Jan. - Feb. 2012
|
|
Large CNG Buses
|
Medium CNG Buses
|
Small CNG Buses
|
Total
|
|
Hubei
|
60
|
5
|
2
|
77
|
|
Henan
|
4
|
24
|
4
|
32
|
|
Guangdong
|
4
|
5
|
2
|
11
|
|
Hunan
|
2
|
20
|
5
|
27
|
|
Guangxi
|
2
|
1
|
1
|
4
|
|
Hainan
|
1
|
0
|
0
|
1
|
|
Total
|
73
|
55
|
14
|
142
|
