Summarize:www.chinabuses.org:I Bus Industry Sales Growth Analysis in the first two months of 2012
1. Overall Sales Growth Condition of Different Lengths
Table 1: Sales Growth Table of Different Lengths in the first two months of 2012
|
|
Total
|
12<L
|
11<L≤12
|
10<L≤11
|
9<L≤10
|
|
First two months of 2012
|
32183
|
579
|
6721
|
3232
|
1693
|
|
First two months of 2011
|
30743
|
272
|
6507
|
2925
|
1476
|
|
Y-O-Y rise
|
4.7
|
112.9
|
3.29
|
10.5
|
14.7
|
| |
8<L≤9
|
7<L≤8
|
6<L≤7
|
5<L≤6
|
3.5<L≤5
|
|
First two months of 2012
|
3563
|
4989
|
4290
|
2203
|
4913
|
|
First two months of 2011
|
3091
|
4328
|
3298
|
2504
|
6334
|
|
Y-O-Y rise
|
15.3
|
15.3
|
30.1
|
-12
|
-22.4
|

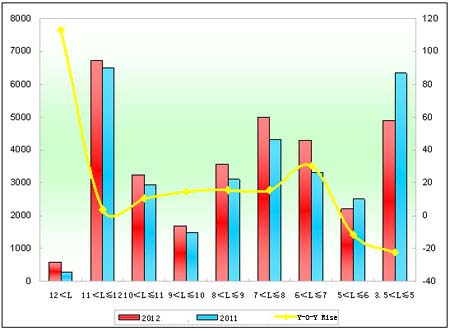
Chart 1: Sales Growth Chart of Different Lengths in the first two months of 2012
We can see from the above that:
Overall sales in the first two months of 2012 increase 4.7% over last year. From the lengths we can see that sales of over-12m, 11m-12m, 10m-11m, 8m-9m, 7m-8m and 6m-7m increase. Sales of over-12m buses increase the most, up to 112.9%, then 6m-7m, 8m-9m, 7m-8m; sales of 3.5m-5m buses decrease the most.
2. Xiamen Golden Dragon Sales Growth Analysis of Different Lengths
Table 2: Xiamen Golden Dragon Sales Growth Table of Different Lengths in the first two months of 2012
|
|
Total
|
12<L
|
11<L≤12
|
10<L≤11
|
9<L≤10
|
|
First two months of 2012
|
2189
|
0
|
293
|
106
|
13
|
|
First two months of 2011
|
3365
|
3
|
482
|
384
|
86
|
|
Y-O-Y rise
|
-34.9
|
-100
|
-39.2
|
-72.4
|
-84.9
|
|
Industry rise
|
4.7
|
112.9
|
3.29
|
10.5
|
14.7
|
| |
8<L≤9
|
7<L≤8
|
6<L≤7
|
5<L≤6
|
3.5<L≤5
|
|
First two months of 2012
|
181
|
67
|
178
|
67
|
1284
|
|
First two months of 2011
|
314
|
166
|
205
|
148
|
1577
|
|
Y-O-Y rise
|
-42.4
|
-59.6
|
-13.2
|
-54.7
|
-18.6
|
|
Industry rise
|
15.3
|
15.3
|
30.1
|
-12
|
-22.4
|

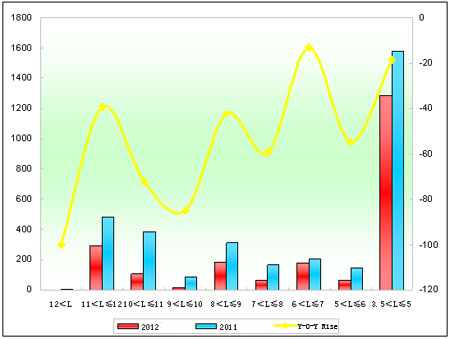
Chart 2: Xiamen Golden Dragon Sales Growth Chart of Different Lengths in the first two months of 2012
We can see from the above that:
(1) Sales of Xiamen Golden Dragon in the first two months of 2012 decrease 34.9% over last year, 40% more than industrial average, which means sales of Golden Dragon decrease the most and are in poor condition in the first two months of 2012.
(2) Sales of all lengths decrease, which is the only enterprise.
(3) Product structure of Xiamen Golden Dragon is not rational that sales of below-8-meter account for 72.9%, more than that in January 2011. (63% in the first two months of 2011)
