Summarize:www.chinabuses.org:II Seat Bus Sales Growth Analysis of Different Lengths in the first two months of 2012
1. Industry Seat Bus Sales Growth Condition of Different Lengths
Table 3: Seat Bus Sales Growth Table of Different Lengths in the first two months of 2012
|
|
Total
|
12<L
|
11<L≤12
|
10<L≤11
|
9<L≤10
|
|
First two months of 2012
|
19390
|
182
|
3998
|
1437
|
683
|
|
First two months of 2011
|
22856
|
61
|
3892
|
1433
|
736
|
|
Y-O-Y rise
|
-15.2
|
198.4
|
2.7
|
0.28
|
-7.2
|
| |
8<L≤9
|
7<L≤8
|
6<L≤7
|
5<L≤6
|
3.5<L≤5
|
|
First two months of 2012
|
2023
|
2375
|
2225
|
1741
|
4726
|
|
First two months of 2011
|
2264
|
2939
|
2915
|
2372
|
6244
|
|
Y-O-Y rise
|
-10.6
|
-19.2
|
-23.7
|
-26.6
|
-24.3
|

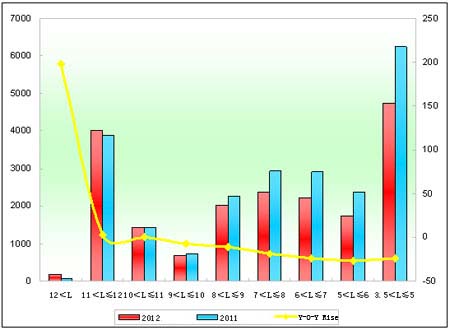
Chart 3: Seat Bus Sales Growth Chart of Different Lengths in the first two months of 2012
We can see from the above that:
Overall sales of seat buses in the first two months of 2012 decrease 15.2% and from the lengths, except large and super large buses, sales of middle and small buses decrease, in which sales of super large buses increase the most while sales of 5m-6m decrease the most.
2. Xiamen Golden Dragon Seat Buses
Table 4: Xiamen Golden Dragon Seat Bus Sales Growth Table of Different Lengths in the first two months of 2012
|
|
Total
|
12<L
|
11<L≤12
|
10<L≤11
|
9<L≤10
|
|
First two months of 2012
|
2117
|
0
|
246
|
98
|
11
|
|
First two months of 2011
|
2860
|
3
|
328
|
189
|
71
|
|
Y-O-Y rise
|
-35.1
|
-100
|
-33.3
|
-92.9
|
-545.5
|
|
Industry rise
|
-15.2
|
198.4
|
2.7
|
0.28
|
-7.2
|
| |
8<L≤9
|
7<L≤8
|
6<L≤7
|
5<L≤6
|
3.5<L≤5
|
|
First two months of 2012
|
177
|
56
|
178
|
67
|
1284
|
|
First two months of 2011
|
314
|
25
|
205
|
148
|
1577
|
|
Y-O-Y rise
|
-77.4
|
55.4
|
-15.2
|
-12.1
|
-22.8
|
|
Industry rise
|
-10.6
|
-19.2
|
-23.7
|
-26.6
|
-24.3
|

Table 4: Xiamen Golden Dragon Seat Bus Sales Growth Table of Different Lengths in the first two months of 2012
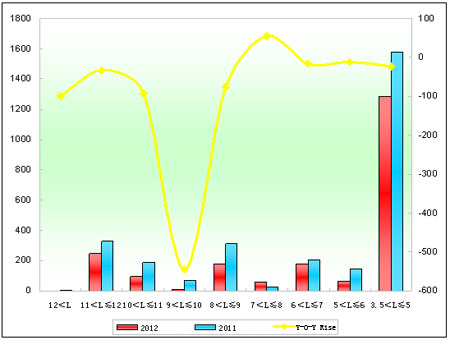
We can see from the above that:
(1) Sales of Xiamen Golden Dragon seat buses in January 2012 decrease 35.1%, 30% less than industrial average.
(2) Except 7-8 meters, sales of other lengths decrease.
