Summarize:www.chinabuses.org:III City Bus Sales Growth Analysis of Different Lengths in the First Four Months of 2012
1. Industry City Bus Sales Growth Condition of Different Lengths
Table 5: City Bus Sales Growth Table of Different Lengths in the First Four Months of 2012
|
|
Total
|
12<L
|
11<L≤12
|
10<L≤11
|
9<L≤10
|
|
First four months of 2012
|
17479
|
640
|
5582
|
3934
|
1530
|
|
First four months of 2011
|
16512
|
472
|
4099
|
3555
|
1938
|
|
Y-O-Y Rise
|
5.86
|
35.6
|
36.2
|
10.7
|
-21.1
|
| |
8<L≤9
|
7<L≤8
|
6<L≤7
|
5<L≤6
|
|
|
First four months of 2012
|
2717
|
2050
|
808
|
198
|
|
|
First four months of 2011
|
2023
|
3267
|
811
|
133
|
|
|
Y-O-Y Rise
|
34.3
|
-37.25
|
-0.37
|
48.9
|
|

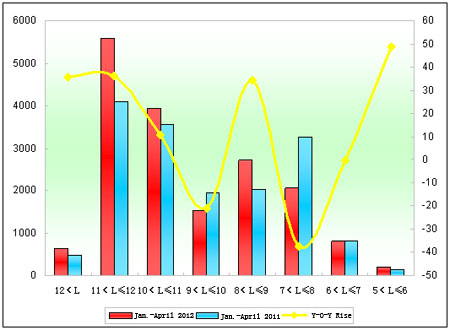
Chart 5: City Bus Sales Growth Chart of Different Lengths in the First Four Months of 2012
We can see from the above that:
Sales of city buses in the first four months of 2012 increase 5.6%. Sales of super large, 11m-12m, 8m-9m and 5m-6m increase over 30%. Sales of 7m-8m decrease the most, up to 37.1%.
2. Suzhou Higer City Buses
Table 6: Suzhou Higer City Bus Sales Growth Table of Different Lengths in the First Four Months of 2012
|
|
Total
|
12<L
|
11<L≤12
|
10<L≤11
|
|
First four months of 2012
|
1382
|
0
|
470
|
546
|
|
First four months of 2011
|
1792
|
10
|
576
|
341
|
|
Y-O-Y Rise
|
-22.9
|
-100
|
-18.4
|
60.1
|
|
Industry Rise
|
5.86
|
35.6
|
36.2
|
10.7
|
| |
9<L≤10
|
8<L≤9
|
7<L≤8
|
|
|
First four months of 2012
|
197
|
89
|
80
|
|
|
First four months of 2011
|
317
|
269
|
279
|
|
|
Y-O-Y Rise
|
-37.9
|
-66.9
|
-71.3
|
|
|
Industry Rise
|
-21.1
|
34.3
|
-37.25
|
|

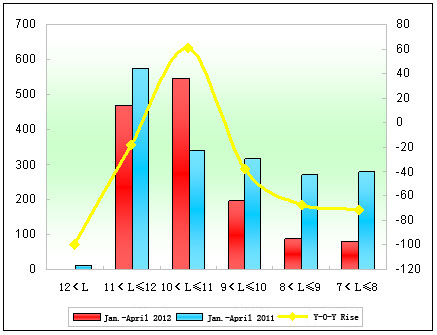
Chart 6: Suzhou Higer City Bus Sales Growth Chart of Different Lengths in the First Four Months of 2012
We can see from the above that:
(1) Sales of Higer city buses in the first four months of 2012 reach 1382 units, increasing 13.9%.
(2) Only sales of 10m-11m increase.
(3) Sales of super large city buses in the first four months of 2012 are zero, while the sales in the first four months of 2011 were 10 units.
