Summarize:www.chinabuses.org:I Bus Industry Sales Growth Analysis in the First Four Months of 2012
1. Overall Sales Growth Condition of Different Lengths
Table 1: Sales Growth Table of Different Lengths in the First Four Months of 2012
|
|
Total
|
12<L
|
11<L≤12
|
10<L≤11
|
9<L≤10
|
|
First four months of 2012
|
71568
|
780
|
14574
|
7584
|
3996
|
|
First four months of 2011
|
65200
|
684
|
12720
|
6976
|
3613
|
|
Y-O-Y Rise
|
9.77
|
14
|
14.6
|
8.7
|
10.6
|
| |
8<L≤9
|
7<L≤8
|
6<L≤7
|
5<L≤6
|
3.5<L≤5
|
|
First four months of 2012
|
8755
|
10036
|
8489
|
5244
|
12110
|
|
First four months of 2011
|
7203
|
9882
|
7595
|
5455
|
11072
|
|
Y-O-Y Rise
|
21.5
|
1.6
|
11.8
|
-3.9
|
9.4
|

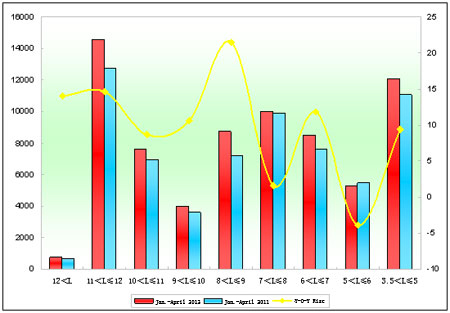
Chart 1: Sales Growth Chart of Different Lengths in the First Four Months of 2012
We can see from the above that:
Sales in the first four months of 2012 increase 9.77% over last year. Except 5m-6m, sales of other lengths increase. Only sales of 8m-9m increase over 20%, others less than 15%.
2. Xiamen Golden Dragon Sales Growth Analysis of Different Lengths
Table 2: Xiamen Golden Dragon Sales Growth Table of Different Lengths in the First Four Months of 2012
|
|
Total
|
12<L
|
11<L≤12
|
10<L≤11
|
9<L≤10
|
|
First four months of 2012
|
6406
|
4
|
684
|
335
|
68
|
|
First four months of 2011
|
7077
|
3
|
887
|
785
|
135
|
|
Y-O-Y Rise
|
-9.5
|
33.3
|
-22.9
|
-57.3
|
-49.6
|
|
Industry Rise
|
9.77
|
14
|
14.6
|
8.7
|
10.6
|
| |
8<L≤9
|
7<L≤8
|
6<L≤7
|
5<L≤6
|
3.5<L≤5
|
|
First four months of 2012
|
536
|
178
|
594
|
246
|
3761
|
|
First four months of 2011
|
675
|
303
|
740
|
379
|
3170
|
|
Y-O-Y Rise
|
-20.6
|
-41.3
|
-19.7
|
-35.1
|
18.6
|
|
Industry Rise
|
21.5
|
1.6
|
11.8
|
-3.9
|
9.4
|

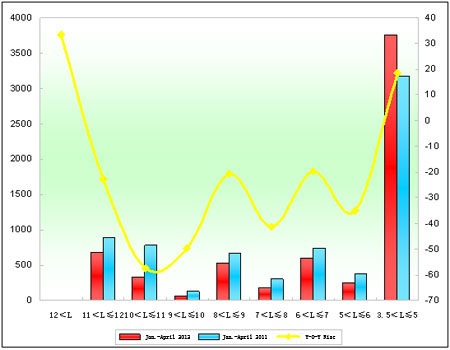
Chart 2: Xiamen Golden Dragon Sales Growth Chart of Different Lengths in the First Four Months of 2012
We can see from the above that:
(1) Sales of Xiamen Golden Dragon in the first four months of 2012 decrease 9.5% over last year, 19% less than industrial average, which means Golden Dragon is suffering from a poor business.
(2) Sales of 3.5m-5m increase 18.6% and sales of super large buses increase a little.
(3) Product structure of Xiamen Golden Dragon is not rational that sales of below-8-meter account for 74.6%.
