Summarize:www.chinabuses.org:II Seat Bus Sales Growth Analysis of Different Lengths in the First Four Months of 2012
1. Industry Seat Bus Sales Growth Condition of Different Lengths
Table 3: Seat Bus Sales Growth Table of Different Lengths in the First Four Months of 2012
|
|
Total
|
12<L
|
11<L≤12
|
10<L≤11
|
9<L≤10
|
|
First four months of 2012
|
44660
|
119
|
8449
|
3349
|
2035
|
|
First four months of 2011
|
47306
|
149
|
7596
|
3416
|
1642
|
|
Y-O-Y Rise
|
-5.6
|
-20.1
|
11.2
|
-2
|
23.9
|
| |
8<L≤9
|
7<L≤8
|
6<L≤7
|
5<L≤6
|
3.5<L≤5
|
|
First four months of 2012
|
5095
|
5126
|
4757
|
4132
|
11598
|
|
First four months of 2011
|
5172
|
6601
|
6758
|
5114
|
10858
|
|
Y-O-Y Rise
|
-1.5
|
-22.3
|
-29.6
|
-19.2
|
6.8
|

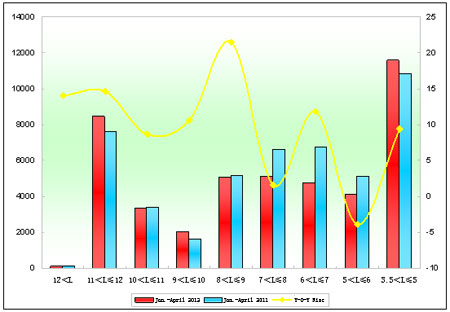
Chart 3: Seat Bus Sales Growth Chart of Different Lengths in the First Four Months of 2012
We can see from the above that:
Seat buses in the first four months of 2012 decrease 5.6%. Sales of super large, 7m-8m and 6m-7m decrease over 20%, while sales of 9m-10m increase 20%.
2. Golden Dragon Seat Buses
Table 4: Xiamen Golden Dragon Seat Bus Sales Growth Table of Different Lengths in the First Four Months of 2012
|
|
Total
|
12<L
|
11<L≤12
|
10<L≤11
|
9<L≤10
|
|
First four months of 2012
|
6050
|
4
|
558
|
268
|
55
|
|
First four months of 2011
|
6143
|
3
|
657
|
347
|
120
|
|
Y-O-Y Rise
|
-1.5
|
33.3
|
-15.1
|
-22.8
|
-54.2
|
|
Industry Rise
|
-5.6
|
-20.1
|
11.2
|
-2
|
23.9
|
| |
8<L≤9
|
7<L≤8
|
6<L≤7
|
5<L≤6
|
3.5<L≤5
|
|
First four months of 2012
|
465
|
100
|
594
|
245
|
3761
|
|
First four months of 2011
|
672
|
55
|
740
|
379
|
3170
|
|
Y-O-Y Rise
|
-30.8
|
81.8
|
-19.7
|
-35.4
|
18.6
|
|
Industry Rise
|
-1.5
|
-22.3
|
-29.6
|
-19.2
|
6.8
|

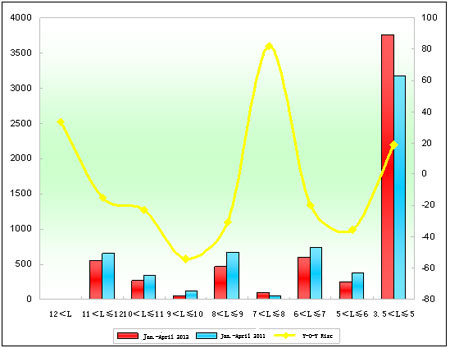
Chart 4: Xiamen Golden Dragon Seat Bus Sales Growth Chart of Different Lengths in the First Four Months of 2012
We can see from the above that:
(1) Sales of Xiamen Golden Dragon in the first four months of 2012 increase -1.5%, 4% more than industrial average, which means Golden Dragon seat buses make a great contribution to its business.
(2) Sales of 3.5m-5m increase 18.6% and sales of super large buses increase a little.
