Summarize:www.chinabuses.org:III City Bus Sales Growth Analysis of Different Lengths in the First Four Months of 2012
1. Industry City Bus Sales Growth Condition of Different Lengths
Table 5: City Bus Sales Growth Table of Different Lengths in the First Four Months of 2012
|
|
Total
|
12<L
|
11<L≤12
|
10<L≤11
|
9<L≤10
|
|
First four months of 2012
|
17479
|
640
|
5582
|
3934
|
1530
|
|
First four months of 2011
|
16512
|
472
|
4099
|
3555
|
1938
|
|
Y-O-Y Rise
|
5.86
|
35.6
|
36.2
|
10.7
|
-21.1
|
| |
8<L≤9
|
7<L≤8
|
6<L≤7
|
5<L≤6
|
|
|
First four months of 2012
|
2717
|
2050
|
808
|
198
|
|
|
First four months of 2011
|
2023
|
3267
|
811
|
133
|
|
|
Y-O-Y Rise
|
34.3
|
-37.25
|
-0.37
|
48.9
|
|

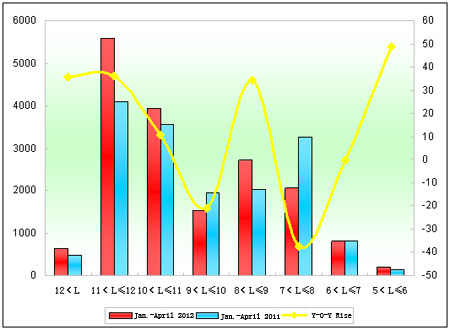
Chart 5: City Bus Sales Growth Chart of Different Lengths in the First Four Months of 2012
We can see from the above that:
Sales of city buses in the first four months of 2012 increase 5.6%. Sales of super large, 11m-12m, 8m-9m and 5m-6m increase over 30%. Sales of 7m-8m decrease the most, up to 37.1%.
2. Xiamen Golden Dragon City Buses
Table 6: Xiamen Golden Dragon City Bus Sales Growth Table of Different Lengths in the First Four Months of 2012
|
|
Total
|
11<L≤12
|
10<L≤11
|
|
First four months of 2012
|
320
|
126
|
67
|
|
First four months of 2011
|
891
|
187
|
438
|
|
Y-O-Y Rise
|
-64.1
|
-32.6
|
-84.7
|
|
Industry Rise
|
5.86
|
36.2
|
10.7
|
| |
9<L≤10
|
8<L≤9
|
7<L≤8
|
|
First four months of 2012
|
0
|
68
|
59
|
|
First four months of 2011
|
15
|
3
|
248
|
|
Y-O-Y Rise
|
-100
|
216.7
|
-76.2
|
|
Industry Rise
|
-21.1
|
34.3
|
-37.25
|

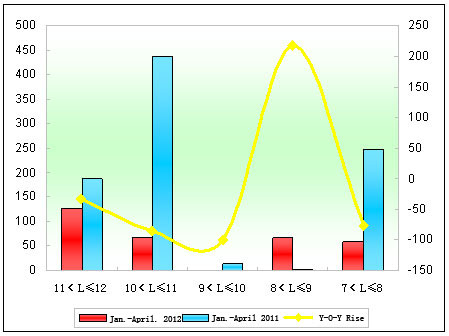
Chart 6: Xiamen Golden Dragon City Bus Sales Growth Chart of Different Lengths in the First Four Months of 2012
We can see from the above that:
(1) Sales of Xiamen Golden Dragon city buses reached 320 units, increasing -64.1% over last year, i.e. 891 units, which means sales of Golden Dragon city buses in the first four months are decreasing.
(2) Sales of 8m-9m increase the most, by 216.7%, i.e. 65 units, which is unable to prevent the decreasing of Golden Dragon city buses.
