Summarize:www.chinabuses.org:III City Bus Sales Growth Analysis of Different Lengths in the First Five Months of 2012
1. Industry City Bus Sales Growth Condition of Different Lengths
Table 5: City Bus Sales Growth Table of Different Lengths in the First Five Months of 2012
|
|
Total
|
12<L
|
11<L≤12
|
10<L≤11
|
9<L≤10
|
|
First five months of 2012
|
22446
|
706
|
7702
|
4570
|
2018
|
|
First five months of 2011
|
21400
|
892
|
5250
|
4891
|
2320
|
|
Y-O-Y Rise
|
4.9
|
-20.9
|
46.7
|
-6.6
|
-13
|
| |
8<L≤9
|
7<L≤8
|
6<L≤7
|
5<L≤6
|
3.5<L≤5
|
|
First five months of 2012
|
3333
|
2797
|
993
|
233
|
94
|
|
First five months of 2011
|
2596
|
3945
|
1025
|
207
|
274
|
|
Y-O-Y Rise
|
28.4
|
-29.1
|
-3.1
|
12.6
|
-65.7
|
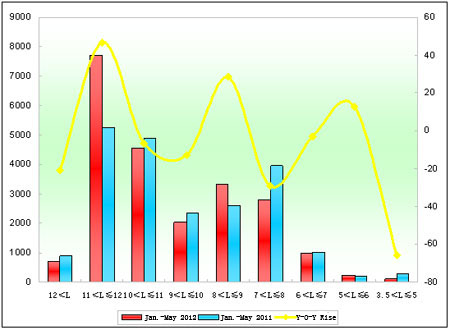
Chart 5: City Bus Sales Growth Chart of Different Lengths in the First Five Months of 2012
We can see from the above that:
Sales of city buses in the first five months of 2012 increase 4.9%, 4.3% more than industrial average. Sales of 3.5m-5m, 6m-7m, 7m-8m, 9m-10m, 10m-11m and super large buses decrease. Sales of 11m-12m increase the most and sales of 7m-8m decrease the most.
2. Xiamen Golden Dragon City Buses
Table 6: Xiamen Golden Dragon City Bus Sales Growth Table of Different Lengths in the First Five Months of 2012
|
|
Total
|
11<L≤12
|
10<L≤11
|
|
First five months of 2012
|
445
|
177
|
110
|
|
First five months of 2011
|
1003
|
196
|
500
|
|
Y-O-Y Rise
|
-55.6
|
-9.7
|
-78
|
|
Industry Rise
|
4.9
|
46.7
|
-6.6
|
| |
9<L≤10
|
8<L≤9
|
7<L≤8
|
|
First five months of 2012
|
20
|
70
|
68
|
|
First five months of 2011
|
15
|
3
|
289
|
|
Y-O-Y Rise
|
33.3
|
2233.3
|
-76.5
|
|
Industry Rise
|
-13
|
28.4
|
-29.1
|
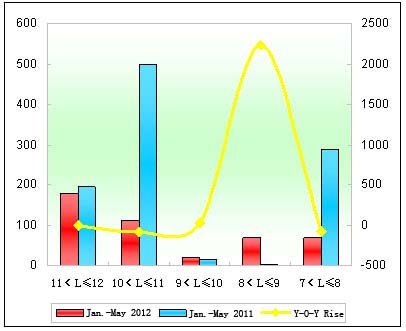
Chart 6: Xiamen Golden Dragon City Bus Sales Growth Chart of Different Lengths in the First Five Months of 2012
We can see from the above that:
(1) Sales of Golden Dragon city buses reach 445 units in the first five months of 2012, decreasing 55.6% over last year, which is the main factor to hamper the development of Golden Dragon.
(2) Only sales of 8m-9m and 9m-10m increase.
 editor@chinabuses.org
 86-10-84933192;


