Summarize:www.chinabuses.org :
Part one: Analysis of Tourist Bus' Sales Statistics in the First Five Months of 2012
Table One: Sales statistics of tourist buses in the first five months of 2012
|
Jan.-May
|
Sales volume
|
Year-on-year growth
|
Remarks
|
|
2012
|
16788
|
12.02
|
Including above 5 meters length tourist buses
|
|
2011
|
14987
|
1.11
|
Including above 5 meters length tourist buses
|
|
2010
|
14822
|
69.1
|
Including above 5 meters length tourist buses
|
|
2009
|
8763
|
-13.4
|
Including above 5 meters length tourist buses
|
|
2008
|
10123
|
24.6
|
Including above 5 meters length tourist buses
|
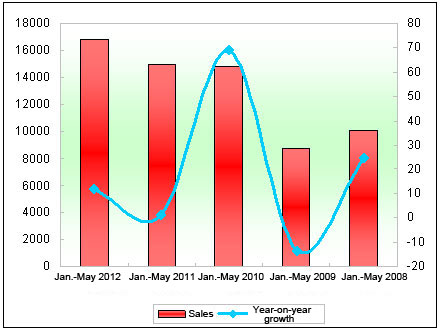
Chart One: Sales statistics of tourist buses in the first five months of 2012
Table Two: Sales growth rate statistics of tourist buses in the first five months of 2012
|
|
Jan.
|
Jan.-Feb.
|
Jan.-March
|
Jan.-April
|
Jan.-May
|
|
Sales growth rate
|
8.9
|
9.3
|
3.64
|
9.92
|
12.01
|
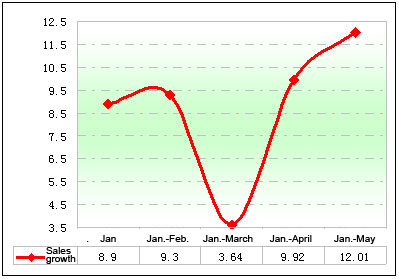
Chart Two: Sales growth rate statistics of tourist buses in the first five months of 2012
From the above data, it is seen that
According to the sales statistics data, in the first five months of the recent five years, the sales growth of them are gradually increasing ( except the financial crisis in 2009 ). Among them, the year of 2010 increased most which reached 69.1 percent and the year of 2011 increased least which reached 1.11 percent. Besides, in the first five months of 2012, the sales growth rate of the tourist buses increase gradually, the sales growth reached 12.01 percent.
The reasons that the sales of tourist buses in the first five months of 2012 decrease are:
1.The overall national macro policy keeps steady in 2012, the general growth has slowed down. Due to the loosened credit of the commercial bank, the loan channels for the tour operators are litter more, so the purchasing ability greatly become strongly.
2. The sales base of the first quarter in 2011 is small, which is favorable for the growth of the buses in 2012.
 editor@chinabuses.org
 86-10-84933192;


