Summarize:
www.chinabuses.org :
Part Five: Sales analysis of mainstream bus builders' tourist bus models (above 8 meters long) in the first five months of 2012
Table Seven: Sales statistics of the mainstream tourist bus builders' tourist bus models (above 8 meters long) in the first five months of 2012
|
Tourist bus models
|
Sales volume
|
Main sales regions
|
Similar models' market share
|
|
ZK6110H
|
93
|
Zhejiang Province & Fujian Province etc.
|
11.00%
|
|
ZK6120HY19
|
69
|
Guangdong Province & Jiangsu Province etc.
|
7.02%
|
|
ZK6127HA19
|
57
|
Guangdong Province & Henan Province etc.
|
6.80%
|
|
ZK6859HE
|
59
|
Jiangsu Province & Anhui Province etc.
|
6.40%
|
|
ZK6100HU
|
55
|
Hubei Province & Jiangxi Province etc.
|
6.72%
|
|
ZK6100HE9
|
77
|
Hunan Province & Guangdong Province etc.
|
8.10%
|
|
ZK6110HA
|
49
|
Jiangsu Province & Zhejiang Province etc.
|
6.11%
|
|
ZK6122H9
|
66
|
Fujian Province & Jiangsu Province etc.
|
7.14%
|
|
ZK6127H19
|
56
|
Hubei Province & Jiangxi Province etc.
|
8.11%
|
|
ZK6127HA
|
48
|
Shandong Province & Guangxi Province etc.
|
6.01%
|
|
ZK6888HA9
|
61
|
Sichuan Province & Anhui Province etc.
|
6.23%
|
|
ZK6908H9
|
63
|
Guangdong Province & Hubei Province etc.
|
6.10%
|
|
ZK6858H9
|
69
|
Henan Province & Shandong Province etc.
|
6.39%
|
|
XMQ6900Y
|
64
|
Zhejiang Province & Fujian Province etc.
|
9.43%
|
|
XMQ6122Y
|
58
|
Zhejiang Province & Jiangxi Province etc.
|
6.40%
|
|
XMQ6858Y
|
57
|
Zhejiang Province & Fujian Province etc.
|
5.33%
|
|
XMQ6117Y
|
46
|
Fujian Province & Zhejiang Province etc.
|
9.14%
|
|
XMQ6859Y1
|
48
|
Fujian Province etc.
|
8.12%
|
|
XMQ6129Y8
|
40
|
Henan Province etc.
|
12.35%
|
|
JNP6105T
|
47
|
Zhejiang Province & Hubei Province etc.
|
5.10%
|
|
JNP6122T
|
36
|
Jiangsu Province etc.
|
4.17%
|
|
KLQ6125B1A
|
78
|
Guangdong Province & Henan Province etc.
|
8.23%
|
|
KLQ6119QAE3
|
46
|
Guangdong Province etc.
|
5.21%
|
|
KLQ6896QAE3
|
39
|
Jiangsu Province etc.
|
5.27%
|
|
KLQ6858
|
45
|
Hubei Province etc.
|
9.20%
|
|
XML6103J23
|
47
|
Jiangsu Province
|
6.21%
|
|
XML6117JE3
|
40
|
Fujian Province
|
7.02%
|
|
BJ6881U6LGB
|
34
|
Beijing etc.
|
5.10%
|
|
HK6907H
|
39
|
Anhui Province & Zhejiang Province etc.
|
6.12%
|
|
HFF6124K40
|
38
|
Anhui Province etc.
|
6.30%
|
From above data, it is seen that
1.Yutong Bus has the most tourist bus models in the table, which cover from 8 meters - 12 meters long. For the sales regional markets, the main regional markets are in Zhejiang Province, Fujian Province, Guangdong Province, Henan Province and Jiangsu Province, which are the main regional markets for the tourist bus market. From the sales data, it is known that the Yutong ZK6110H tourist bus is the best selling bus model.
2. King Long Bus models rank top two in the tourist bus market. Its main regional markets are in Zhejiang Province and Fujian Province etc. The best selling of its tourist bus model is XMQ6900Y. The tourist bus products of King Long Bus also cover from 8 meters - 12 meters long.
3. Higer Bus models are in the third place of the tourist bus market. Its tourist bus products also cover from 8 meters - 12 meters long. The main regional markets of Higer Bus are in Guangdong Province and Hubei Province etc. The best selling of Higer tourist bus model is KLQ6125B1A.
4. Golden Dragon Bus models are relatively weak compared to the other top three bus builders. Its best selling model are XML6103J23.
Part Six: Analysis of Tourist Buses' Sales Statistics in Various Prices in the First Five Months of 2012 in China
Table Eight: Sale statistics of tourist buses in various prices in the first five months of 2012
|
|
RMB 0.15~0.25 million
|
RMB 0.25~0.30 million
|
RMB 0.30~0.40 million
|
RMB 0.40~0.50 million
|
|
Sales volume
|
1410
|
3139
|
3660
|
3307
|
|
Sales proportion
|
8.4
|
18.7
|
21.8
|
19.7
|
|
|
RMB 0.50~0.60 million
|
RMB 0.60~0.70 million
|
Above RMB 0.70 million
|
|
|
Sales volume
|
3374
|
1645
|
253
|
|
|
Sales proportion
|
20.1
|
9.8
|
1.51
|
|
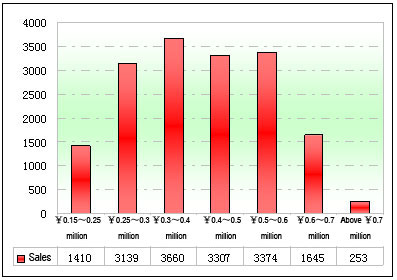
Chart Seven: Sale statistics of tourist buses in various prices in the first five months of 2012
From the above data, it is seen that the price structure of the tourist buses in the first five months of 2012 shows " a few at each extreme and many in between ". Based on the various prices of the buses to divide the tourist bus market, the sales volume of the tourist buses valuing among RMB 0.25~0.60 million are similar. The sales volume of the tourist buses valuing RMB 0.30~0.40 million is the biggest, then it is followed by the tourist buses valuing RMB 0.50~0.60 million and RMB 0.40~0.50 million.
Part Seven: The luxurious tourist bus market was developing fast in the last four years. The market concentration rate was gradually increasing each year but it slows down in the first five months of 2012.
Table Nine: Sale statistics of luxurious tourist buses valuing above RMB 0.70 million in the first five months of recent five years
|
Jan.- May
|
Sales volume
|
Above RMB 0.70 million
|
Market concentration rate
|
|
2012
|
16788
|
253
|
1.51
|
|
2011
|
14987
|
335
|
2.23
|
|
2010
|
14822
|
276
|
1.86
|
|
2009
|
8763
|
151
|
1.72
|
|
2008
|
10123
|
173
|
1.7
|
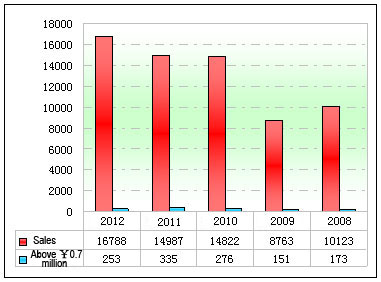
Chart Eight: Sale statistics of luxurious tourist buses valuing above RMB 0.70 million in the first five months of recent five years
From above data, it is seen that
The sales of the luxurious tourist buses valuing above RMB 0.70 million in the first five months in the recent five years are gradually increasing and so do their market concentration rates except the financial crisis in 2009. It shows the luxurious tourist bus market capacity becomes bigger and bigger now, but the biggest one is only 2.0 percent and in the first five months in 2012, it is only 1.51 percent.
According to the research, most of the luxurious tourist buses valuing above RMB 0.70 million are used in senior tourism scenic spot and entertainment important VIP visitors. Besides, each year, the luxurious tourist buses' need in the tourism scenic spot is about 800 units and most of their prices are above RMB 0.7 million. In the first five months of 2012, it sells 16,788 units of tourist buses. But only 253 units of tourist buses are used in senior tourism scenic spots, which accounts for nearly 1.51 percent of the market share. Compared to last year, it declined 0.72 percent. It shows the uncertainty development of the high end luxurious tourist buses due to its high prices.
 editor@chinabuses.org
 86-10-84933192;


