Summarize:www.chinabuses.org:
Part Four: General Unit Prices Analysis on the Coach Market in Five Main Regional Markets in 2008~2012
Table Five: Unit price statistics of coaches in five main regional markets in Jan.-May in 2008~2012
|
|
Guangdong Province
|
Jiangsu Province
|
Fujian Province
|
Shandong Province
|
Henan Province
|
|
2008
|
28.17
|
27.91
|
25.23
|
27.4
|
25.03
|
|
2009
|
29.54
|
28.3
|
26.61
|
27.7
|
25.24
|
|
2010
|
31.92
|
30.9
|
28.31
|
29.3
|
27.49
|
|
2011
|
33.03
|
32
|
29.61
|
29.6
|
28.79
|
|
2012
|
34.84
|
32.7
|
30.12
|
30.4
|
29.68
|

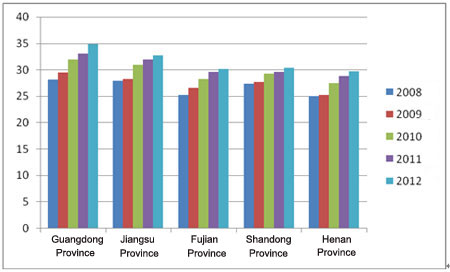
Chart Five: Unit price statistics of coaches in five main regional markets in Jan.-May in 2008~2012
From above data, it is seen that the unit prices of the coach products in the main five regional markets are increasing each year, which shows the coach level that the purchaser choose is also increasing. The unit price of the coach valuing RMB 315,000 in Guangdong Province is the highest. Then it is followed by Jiangsu area, whose unit price reaches RMB 303.600.
Part Five: General Analysis on the Different Fuel Type Coaches in Five Main Regional Markets in Jan.-May in 2008~2012
Table Six: Sales statistics of different fuel type coaches in five main regional markets in Jan.-May in 2008~2012
|
|
|
Jiangsu Province
|
Guangdong Province
|
Shandong Province
|
Henan Province
|
Fujian Province
|
|
Diesel Coaches
|
2008
|
73.8
|
73.1
|
74.8
|
76
|
74.4
|
|
2009
|
74
|
73.2
|
75.7
|
77.2
|
74.8
|
|
2010
|
75.3
|
74
|
76
|
77.6
|
75.3
|
|
2011
|
76.8
|
74.9
|
78
|
77.9
|
76.1
|
|
2012
|
77
|
75.5
|
78.1
|
78
|
76.8
|
|
Gasoline Coaches
|
2008
|
15
|
14.3
|
13.7
|
13.8
|
14.6
|
|
2009
|
14.3
|
13.9
|
12.8
|
12.7
|
14.5
|
|
2010
|
13.8
|
13.8
|
12.6
|
12
|
13
|
|
2011
|
13.7
|
13.6
|
12.2
|
11.8
|
12.7
|
|
2012
|
13.6
|
12.7
|
11
|
11.7
|
12.1
|
|
CNG Coaches
|
2008
|
4.4
|
4.8
|
4.2
|
3
|
2.7
|
|
2009
|
4.6
|
5.2
|
4.6
|
3.1
|
2.95
|
|
2010
|
5
|
5.7
|
4.8
|
3.3
|
3.23
|
|
2011
|
5.2
|
5.8
|
4.9
|
3.4
|
3.61
|
|
2012
|
5.4
|
6.3
|
4.91
|
3.6
|
3.7
|

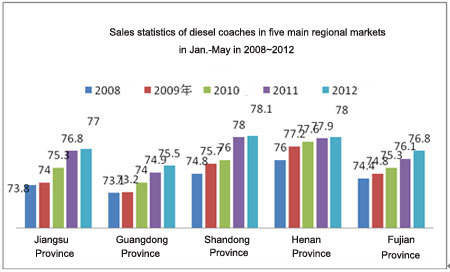
Chart Six: Sales statistics of diesel coaches in five main regional markets in Jan.-May in 2008~2012

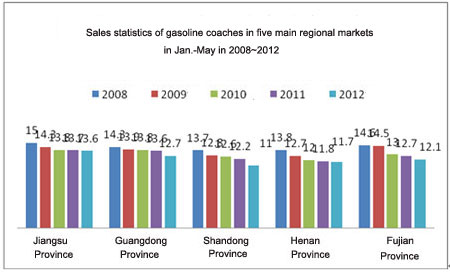
Chart Seven: Sales statistics of gasoline coaches in five main regional markets in Jan.-May in 2008~2012

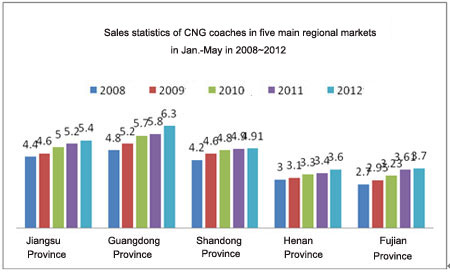
Chart Eight: Sales statistics of CNG coaches in five main regional markets in Jan.-May in 2008~2012
From above data, it is seen that the sales of the diesel coaches accounts for nearly 70%~80% market shares in the main five regional markets. The sales of the gasoline coaches is in top two but its market share show decreasing trend. The sales of CNG coach is in top three and it is increasing each year, but there are still some problems limit the development of the CNG coaches.
