Summarize:www.chinabuses.org:
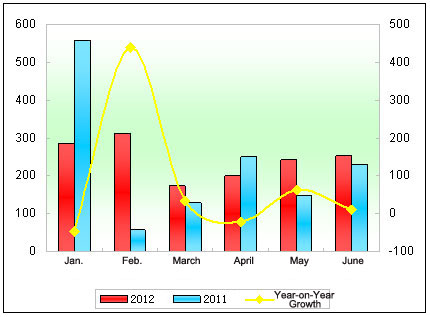
According to the data center of www.chinabuses.com, in Jan.-June of 2012, the sales volume of the luxurious coaches valuing above ¥0.9 million are 1,468 units, which increases by 93 units, which are 1,375 units in Jan.-June 2011. The year-on-year growth reaches 6.76%.
Part One: General Monthly Sales Analysis on the Market of Luxurious Coach Valuing above ¥ 0.9 Million in Jan.-June of 2011~2012
Table One: Monthly statistics of the luxurious coaches valuing above ¥ 0.9 million in Jan.-June of 2011~2012
|
|
Jan.
|
Feb.
|
March
|
April
|
May
|
June
|
|
2012
|
288
|
313
|
174
|
200
|
241
|
252
|
|
2011
|
559
|
58
|
130
|
251
|
148
|
229
|
|
Year-on-Year Growth
|
-48.5
|
439.7
|
33.8
|
-20.3
|
62.8
|
10.04
|

Chart One: Monthly statistics of the luxurious coaches valuing above ¥ 0.9 million in Jan.-June of 2011~2012
From above data, it is seen the year-on-year growth of the luxurious coaches in Jan.-June 2012 is 6.76%, but in Jan. & April,it shows in negative growth. The sales growth in Jan.-June 2012 shows uncertainty growth trend.
Part Two: General Sales Analysis on Market of Luxurious Coaches Valuing above ¥ 0.9 Million in Jan.- June of 2007~2012
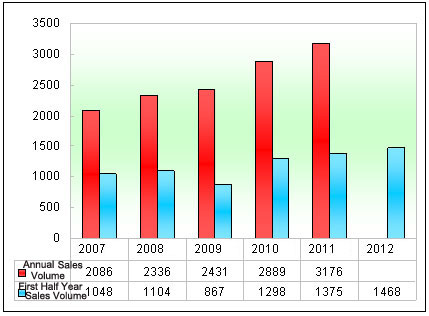
Table Two: Sales statistics of the luxurious coaches valuing above ¥ 0.9 million in Jan.-June of 2007~2012
|
|
2007
|
2008
|
2009
|
2010
|
2011年
|
2012
|
|
Annual Sales Volume
|
2086
|
2336
|
2431
|
2889
|
3176
|
|
|
First Half Year Sales Volume
|
1048
|
1104
|
867
|
1298
|
1375
|
1468
|

Chart Two: Sales statistics of the luxurious coaches valuing above ¥ 0.9 million in Jan.-June of 2007~2012
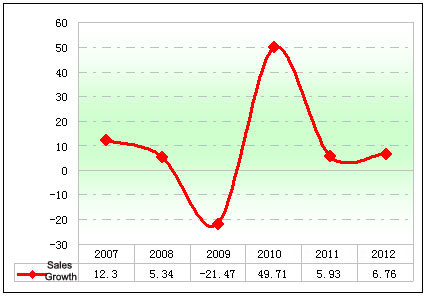
Table Three: Sales growth statistics of the luxurious coaches valuing above ¥ 0.9 million in Jan.-June of 2008~2012
|
First Half Year Sales Volume
|
2008
|
2009
|
2010
|
2011
|
2012
|
|
Sales Volume
|
301
|
202
|
333
|
338
|
388
|
|
Sales Growth
|
20.9
|
-32.9
|
64.9
|
1.5
|
14.8
|

Chart Three: Sales growth statistics of the luxurious coaches valuing above ¥ 0.9 million in Jan.-June of 2008~2012
From above data, it is seen that The sales volume of the luxurious coaches valuing above ¥ 0.9 million in Jan.-June of 2008~2012 change from 2086 units to 3200 units. Except 2009( financial crisis ), the sales of the luxurious coaches from 2007 to 2012 is increasing. The highest one is in 2012, then it is followed by 2011.
