Summarize:www.chinabuses.org:
Part one: General Sales Analysis on the Market of New Energy Bus in the First Half Year of 2012
According to the industry statistic from www.chinabuses.com, it shows that in Jan. -June 2012, 2,456 units of new energy buses are sold in China, which declined by 18.1 percent comparing to Jan.-June 2011. And the new energy buses & coaches' sales volume in the first half year of 2012 accounts for 94.55 percent of the total sales volume of new energy commercial vehicles. From the monthly sales, in Feb. & March, the sales of the new energy buses & coaches are all over 600 units. The large & medium new energy buses & coaches are still the main forces to make the new energy vehicles commercialization.
Table One: Statistic of new energy buses' sales volume in Jan. - June 2007-2012
|
Jan.-June
|
2007
|
2008
|
2009
|
2010
|
2011
|
2012
|
|
Large new energy buses
|
38
|
112
|
329
|
1567
|
2001
|
1669
|
|
Medium new energy buses
|
336
|
449
|
421
|
863
|
958
|
750
|
|
Small new energy buses
|
184
|
33
|
19
|
34
|
39
|
37
|
|
Total
|
558
|
594
|
769
|
2464
|
2998
|
2456
|
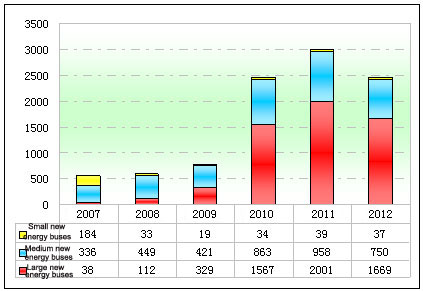
Chart One: Statistic of new energy buses' sales volume in Jan. - June 2007-2012
From above data, it is seen that
The sales volume of the new energy buses in Jan.-June 2007-2011 were increasing, but the sales growth in Jan.-June 2012 is in negative, which declined 18.1 percent from the first half year of 2011.
In the first half year of 2012, the medium new energy buses decreased the most among the sales of the new energy buses. That is to say, the sales of the new energy among 7-meter to 10-meter long buses decreased the most. And the small new energy buses decreased the least.
In the sales of the new energy buses, the biggest market share is the large new energy bus, then it is followed by medium new energy bus and small new energy bus.
Part Two: General Sales Analysis of New Energy Bus in the Jan.-June of 2012
Table Two: Statistic of new energy buses’ sales volume in Jan. - June 2012
|
|
Jan.
|
Feb.
|
March
|
April
|
May
|
June
|
|
2012
|
374
|
602
|
611
|
112
|
306
|
451
|
|
2011
|
711
|
123
|
1076
|
787
|
429
|
502
|
|
Year-on-year Growth
|
-89.6
|
389.4
|
-43.2
|
-85.7
|
-28.7
|
-10.2
|
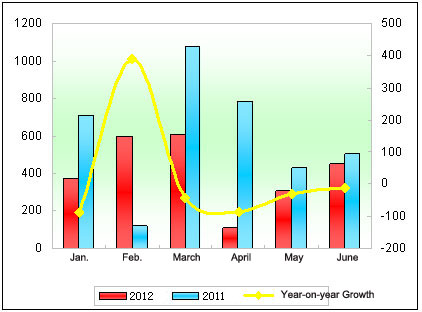
Chart Two: Statistic of new energy buses’ sales volume in Jan. - June 2012
From above data, it is seen that in the first half year of 2012, in monthly sales volumes, only the sales growth in February is in positive due to the Spring Festival in China and the other five months are in negative growth. It shows the new energy development is now in its "Cold Age".
 editor@chinabuses.org
 86-10-84933192;


