Summarize:www.chinabuses.org:
Part Three: General Sales Analysis on the Regional Markets of New Energy Bus in the First Half Year of 2012
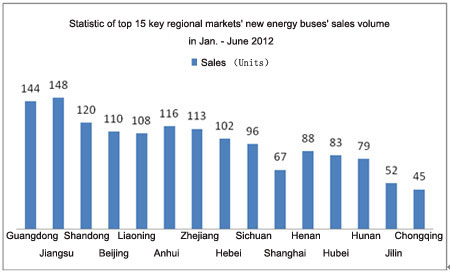
Table Three: Statistic of top 15 key regional markets' new energy buses' sales volume in Jan. - June 2012
Remarks Including pure electric buses, hybrid buses, fuel cell buses and full gas buses etc.
|
No.
|
Regional Markets
|
Sales volume
|
Remarks
|
|
1
|
Guangdong
|
144
|
Including pure electric buses, hybrid buses, fuel cell buses and full gas buses etc.
|
|
2
|
Jiangsu
|
148
|
Including pure electric buses, hybrid buses, fuel cell buses and full gas buses etc.
|
|
3
|
Shandong
|
120
|
Including pure electric buses, hybrid buses, fuel cell buses and full gas buses etc.
|
|
4
|
Beijing
|
110
|
Including pure electric buses, hybrid buses, fuel cell buses and full gas buses etc.
|
|
5
|
Liaoning
|
108
|
Including pure electric buses, hybrid buses, fuel cell buses and full gas buses etc.
|
|
6
|
Anhui
|
116
|
Including pure electric buses, hybrid buses, fuel cell buses and full gas buses etc.
|
|
7
|
Zhejiang
|
113
|
Including pure electric buses, hybrid buses, fuel cell buses and full gas buses etc.
|
|
8
|
Hebei
|
102
|
Including pure electric buses, hybrid buses, fuel cell buses and full gas buses etc.
|
|
9
|
Sichuan
|
96
|
Including pure electric buses, hybrid buses, fuel cell buses and full gas buses etc.
|
|
10
|
Shanghai
|
67
|
Including pure electric buses, hybrid buses, fuel cell buses and full gas buses etc.
|
|
11
|
Henan
|
88
|
Including pure electric buses, hybrid buses, fuel cell buses and full gas buses etc.
|
|
12
|
Hubei
|
83
|
Including pure electric buses, hybrid buses, fuel cell buses and full gas buses etc.
|
|
13
|
Hunan
|
79
|
Including pure electric buses, hybrid buses, fuel cell buses and full gas buses etc.
|
|
14
|
Jilin
|
52
|
Including pure electric buses, hybrid buses, fuel cell buses and full gas buses etc.
|
|
15
|
Chongqing
|
45
|
Including pure electric buses, hybrid buses, fuel cell buses and full gas buses etc.
|
|
|
Total
|
1471
|
Including pure electric buses, hybrid buses, fuel cell buses and full gas buses etc.
|

Chart Three: Statistic of top 15 key regional markets' new energy buses' sales volume in Jan. - June 2012
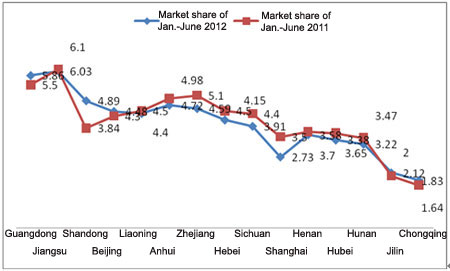
Table Four: Statistic of top 15 key regional markets' new energy buses' market shares in Jan. - June 2012
|
No.
|
Regional Markets
|
Market shares in Jan.-June, 2012
|
Market shares in Jan.-June, 2011
|
|
1
|
Guangdong
|
5.86
|
5.5
|
|
2
|
Jiangsu
|
6.03
|
6.1
|
|
3
|
Shandong
|
4.89
|
3.84
|
|
4
|
Beijing
|
4.48
|
4.3
|
|
5
|
Liaoning
|
4.4
|
4.5
|
|
6
|
Anhui
|
4.72
|
4.98
|
|
7
|
Zhejiang
|
4.59
|
5.1
|
|
8
|
Hebei
|
4.15
|
4.5
|
|
9
|
Sichuan
|
3.91
|
4.4
|
|
10
|
Shanghai
|
2.73
|
3.5
|
|
11
|
Henan
|
3.58
|
3.7
|
|
12
|
Hubei
|
3.38
|
3.65
|
|
13
|
Hunan
|
3.22
|
3.47
|
|
14
|
Jilin
|
2.12
|
2
|
|
15
|
Chongqing
|
1.83
|
1.64
|
|
|
Total
|
59.89
|
61.18
|

Chart Four: Statistic of top 15 key regional markets' new energy buses’ market shares in Jan. - June 2012
From above data, it is seen that
1. In the first half year of 2012, Jiangsu Province accounts for the biggest market share of the new energy buses and its the market share reaches 6.03 percent, which declines 0.07 percent compared to Jan.-June 2011. In this area, the market needs are from Suzhou City, Wuxi City, Changzhou City and Nanjing City. The second biggest market share is in Guangdong Province, which rises by 0.36 percent comparing to Jan.-June 2011.
2. The top six regional markets of new energy buses Jiangsu Province,Guangdong Province, Shandong Province, Anhui Province, Zhejiang Province and Liaoning Province, where the government implements the new energy buses' development.
3. The new energy bus' market shares of the top 15 key regional markets reaches 59.89 percent but the concentration is not high, which decrease 1.3 percent from the first half year of 2011. It shows the new energy buses' needs in the regional markets are decreasing.
4. In Sichuan Province, the market share of the new energy buses decreased from 4.4 percent in 2011 to 3.91 percent in 2012, which is the decreasing most regional market. It shows that there is some development bottleneck in its new energy bus market.
5. The sales of the new energy buses in different regional markets are rather unbalanced. It shows the sales in economic development markets are good but the market share is decreasing. For other regional markets, the new energy bus sales are increasing gradually.
