Summarize:www.chinabuses.org:
Part Four: Profit Contribution Analysis of Coach Products Valuing RMB 0.3~0.5 Million in Q1 ~ Q3 of 2007- 2012
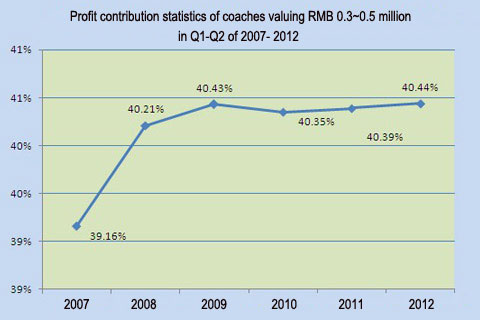
Table Five: Profit contribution statistics of coach products valuing RMB 0.3~0.5 million in Jan.-Sept. of 2007- 2012
|
Jan.-Sept.
|
2007
|
2008
|
2009
|
2010
|
2011
|
2012
|
|
Profit contribution statistics of coach products valuing RMB 0.3~0.5 million
|
39.16%
|
40.21%
|
40.43%
|
40.35%
|
40.39%
|
40.44%
|

For Large & Medium Sized Coach industry, the profit contribution ratio has been stable at around 40 percent, which is the main part constitute to the bus profit. The profit contribution ratio is 0.866, which is between the high luxurious coaches and low grade coaches.
Part Five: Profit Contribution Analysis of Coach Products in Each Price Segment in the Q1 ~ Q3 of 2007- 2012
Table Six: Profit contribution statistics of each price coach product segments in Q1 ~ Q3 of 2007- 2012
|
|
Below RMB 0.2 million
|
RMB 0.2 ~ 0.3 million
|
RMB 0.3 ~ 0.4 million
|
RMB 0.4 ~ 0.5 million
|
RMB 0.5 ~ 0.9 million
|
Above RMB 0.9 million
|
|
Average Profit Contribution Ratio
|
7.33%
|
11.24%
|
19.36%
|
21.08%
|
28.79%
|
12.2%
|
|
Market Share
|
14.86%
|
22.64%
|
24.22%
|
24%
|
12.6%
|
1.68%
|
|
Contribution Rate (Average Profit Contribution Ratio/Market Share)
|
0.493%
|
0.496%
|
0.799%
|
0.878%
|
2.04%
|
7.26%
|
Part Six: Analysis of Coach Products Valuing RMB 0.3~0.5 million in Top Ten Regional Markets in Q1 ~ Q3 of 2011- 2012
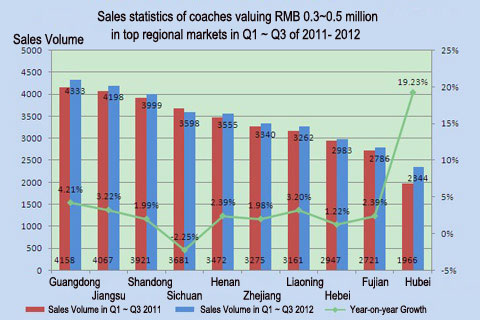
Table Seven: Sales statistics of products valuing RMB 0.3~0.5 million in top ten regional markets in Q1 ~ Q3 of 2011- 2012
|
|
Regional Markets
|
Sales Volume in Jan.-Sept. 2011
|
Sales Volume in Jan.-Sept. 2012
|
Year-on-year Growth
|
|
1
|
Guangdong Province
|
4158
|
4333
|
4.21%
|
|
2
|
Jiangsu Province
|
4067
|
4198
|
3.22%
|
|
3
|
Shandong Province
|
3921
|
3999
|
1.99%
|
|
4
|
Sichuan Province
|
3681
|
3598
|
-2.25%
|
|
5
|
Henan Province
|
3472
|
3555
|
2.39%
|
|
6
|
Zhejiang Province
|
3275
|
3340
|
1.98%
|
|
7
|
Liaoning Province
|
3161
|
3262
|
3.20%
|
|
8
|
Hebei Province
|
2947
|
2983
|
1.22%
|
|
9
|
Fujian Province
|
2721
|
2786
|
2.39%
|
|
10
|
Hubei Province
|
1966
|
2344
|
19.23%
|
|
|
Total
|
33396
|
34398
|
3.08%
|

Chart Three: Sales statistics of products valuing RMB 0.3~0.5 million in top regional markets in Jan.-Sept. of 2011- 2012
1. On the top 10 mainstream regional markets, the market share of the large & medium sized coaches in Jan.-Sept. 2012 was 34398/50897=67.58 percent; The market share in Jan.-Sept. 2011 was 33396/48480=68.89 percent. It decreased by 1.31 percent, which shows the market concentration of it decreased slightly.
2. Guangdong Province, Jiangsu Province and Shandong Province were the top three mainstream regional markets in the market of products valuing RMB 0.3~0.5 million.
