Summarize:www.chinabuses.org :
Part Three: Sales Analysis of the Tourist buses in Main Regions in Jan.-Oct. 2012
In the regional markets concentration rate, the main sales regions of the tourist bus market is different from the city bus and inter-city bus markets, which have each own concentration regions. It shows the tourist bus market is wide and it is not limited by the economic situation.
Table Three: Sales statistics of tourist buses in main regions in Jan.-Oct. 2012
|
|
No.
|
Regions Market Shares in Jan.-Oct. 2011
|
Market Shares in Jan.-Oct. 2012
|
Year-on-year Growth
|
|
1
|
Hainan
|
4.73
|
4.74
|
+0.01
|
|
2
|
Jiangsu
|
4.62
|
4.64
|
+0.02
|
|
3
|
Sichuan
|
4.34
|
4.32
|
-0.02
|
|
4
|
Yunan
|
4.21
|
4.20
|
-0.01
|
|
5
|
Guizhou
|
3.98
|
3.94
|
-0.04
|
|
6
|
Zhejiang
|
3.96
|
3.99
|
+0.03
|
|
7
|
Guangdong
|
3.93
|
3.88
|
-0.05
|
|
8
|
Anhui
|
3.89
|
3.85
|
-0.04
|
|
9
|
Beijing
|
3.79
|
3.83
|
+0.04
|
|
10
|
Liaoning
|
3.73
|
3.77
|
+0.04
|
|
|
Total
|
41.18
|
41.16
|
-0.02
|

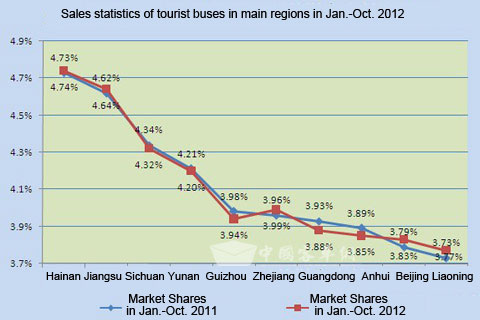
Chart Three: Sales statistics of tourist buses in main regions in Jan.-Oct. 2012
From above data, it is seen that,
1.The total market shares of the top ten regional markets for tourists buses in the first ten months of 2012 were 41.16 percent. And the other 18 regional markets' market share were 58.84 percent. But for other segment bus markets, the top ten regional markets' concentration are over or nearly 65 percent. It indicates that the market concentration of the tourist buses is not as high as other bus markets and the balanced development of the tourist bus markets in China.
2. Hainan Province is the biggest tourist bus market for famous tourist attractions. Then it is followed by Jiangsu Province. The sales of the tourist bus in Guangdong Province , Guizhou Province and Anhui Province decrease most.
3.Comparing to the same period of 2011, the market share of the tourist buses in each regional markets only change a litter. Though some areas decrease or increase, the growth rate is also very small. It indicates the tourist bus market in each regional areas are in the relatively balanced situation.
Part Four: Analysis of Tourist Bus' Sales Statistics in the First Ten Months of 2004-2012
The seven mainstream bus builders are: Yutong Bus,Zhongtong Bus,King Long Bus, Golden Dragon Bus, Higer Bus, Ankai Bus and Youngman Bus.
Table Four: Market share statistics of top seven mainstream bus builders' tourist buses in the first ten months of 2004-2012
Remarks Including the 8-meter above tourist buses
|
|
Jan.- Oct. 2004
|
Jan.- Oct. 2005
|
Jan.- Oct. 2006
|
Jan.- Oct. 2007
|
Jan.- Oct. 2008
|
|
Market Share
|
42.22
|
43.30
|
46.33
|
49.69
|
52.28
|
| |
Jan.- Oct. 2009
|
Jan.- Oct. 2010
|
Jan.- Oct. 2011
|
Jan.- Oct. 2012
|
|
|
Market Share
|
55.32
|
58.99
|
68.66
|
69.37
|
|

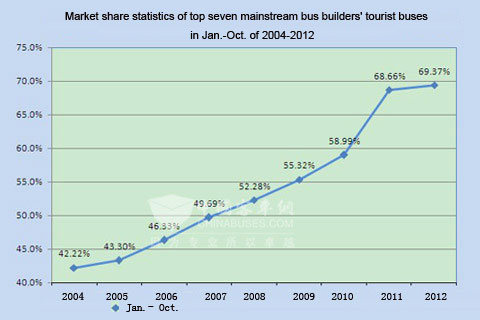
Chart Four: Market share statistics of top seven mainstream bus builders' tourist buses in Jan.-Oct. of 2004-2012
From above data, it is seen that the market share of the top seven mainstream bus builders is increasing from 42.22 percent in 2004 to 69.37 percent in 2012. The monopoly trend of the mainstream bus builders becomes stronger and stronger. It reflects the tourist operators are now more and more concerning the famous brands due to their better service network and good quality tourist bus products.
