Summarize:www.chinabuses.org:
2. Monthly Sale Analysis of LNG Buses on Large, Medium and Small Sizes in Jan.- Oct. 2012
Table Two: Statistics of LNG Buses Sales on Large, Medium and Small Sizes in Jan.- Oct. 2012
| |
Jan.
|
Feb.
|
March
|
April
|
May
|
June
|
July
|
August
|
Sept.
|
Oct.
|
Total
|
|
Large LNG Buses
|
147
|
156
|
259
|
189
|
200
|
253
|
220
|
167
|
149
|
144
|
1884
|
|
Medium LNG Buses
|
80
|
81
|
133
|
95
|
190
|
158
|
167
|
123
|
110
|
104
|
1241
|
|
Small LNG Buses
|
40
|
39
|
64
|
49
|
77
|
101
|
100
|
65
|
80
|
73
|
688
|
|
Total
|
267
|
276
|
456
|
333
|
467
|
512
|
487
|
355
|
339
|
321
|
3813
|

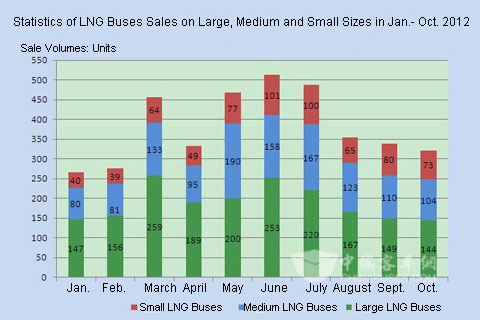
Chart Two: Statistics of LNG Buses Sales on Large, Medium and Small Sizes in Jan.- Oct. 2012
From above data, it is seen that
① LNG buses are divided into large LNG buses, medium LNG buses and small LNG buses. From the different sizes of the LNG buses, it can be viewed some laws in LNG buses' sales. In Jan.- Oct. 2012, in each monthly sales, the large LNG buses were higher than the medium LNG buses. And the sales of medium LNG buses were higher than the small LNG buses.
② In Jan.- Oct. 2012, the total sales of large LNG buses were 1,884 units; The medium LNG buses were 1,241 units and the small LNG buses were 688 units. And they respectively accounted for 49.4%, 32.5% and 18% of the total sales of LNG buses in the first ten months of 2012.
Part Two: Analysis of LNG Buses’ Sales in China’s Different Regional Markets in the First Ten Months of 2012
Table Three: Statistic of LNG Buses’ Sales in China’s Different Regional Markets in the First Ten Months of 2012
|
No.
|
Regional Market
|
Sale Volumes
|
Market share
|
|
1
|
Sichuan
|
287
|
7.53
|
|
2
|
Xingjiang
|
234
|
6.14
|
|
3
|
Jilin
|
223
|
5.85
|
|
4
|
Chongqing
|
212
|
5.56
|
|
5
|
Hubei
|
201
|
5.27
|
|
6
|
Guangdong
|
189
|
4.96
|
|
7
|
Shanxi
|
126
|
3.30
|
|
8
|
Shandong
|
122
|
3.20
|
|
9
|
Zhejiang
|
105
|
2.75
|
|
10
|
Anhui
|
89
|
2.33
|
|
11
|
Beijing
|
78
|
2.04
|
|
12
|
Tianjing
|
73
|
1.91
|
|
13
|
Hebei
|
66
|
1.73
|
|
14
|
Henan
|
59
|
1.55
|
|
15
|
Shaanxi
|
49
|
1.29
|
|
|
Total
|
2113
|
55.42
|

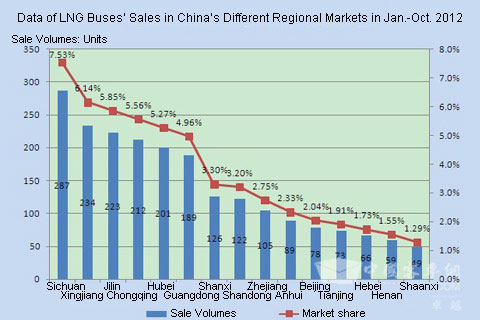
Chart Three: Statistic of LNG Buses’ Sales in China’s Different Regional Markets in the First Ten Months of 2012
1. The biggest regional market of LNG buses is in Sichuan which sold 287 units and it accounted for 7.53% of the all sales of LNG buses. The second one is Xinjiang regional market and the third one is in Jilin. But their market shares are much less than the Sichuan's.
2. In the sales of the LNG buses, the top fifteen regional markets sold 2,113 units, which accounted for nearly 55.42% of the total sales of the LNG buses. It is seen the sales of LNG buses in different regional markets are rather different and unbalanced.
