Summarize:www.chinabuses.org: I. Sales Analysis of New-energy Buses in Jan.-May 2013
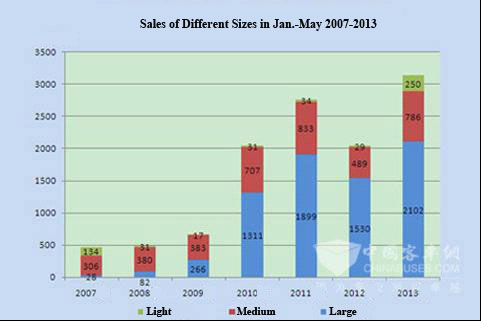
Large buses, with the largest sales volume, play a key role in the growth of new-energy bus market; sales of light buses increase the most. The latest statistical data show in the frist five months sales of new-energy buses (including hybrid and pure-electric ones) reach 3138 units, increasing by 53.22% over the same period in 2012 (2048 units), accounting for 93.5% of the total of new-energy CVs.
January, March and April, as the booming months, see an average of over 700 buses sold per month. Large and medium city buses, mainly purchased by governments and public institutions, play a key role in the commercialization of new-energy vehicles, thanks to the policy support. The pressure of energy deficiency and environmental protection makes new-energy vehicles future orientation of auto industry and new-energy buses become the focus.
Sales of Different Sizes in Jan.-May 2008-2013
|
Jan.-May
|
2007
|
2008
|
2009
|
2010
|
2011
|
2012
|
2013
|
|
Large
|
28
|
82
|
266
|
1311
|
1899
|
1530
|
2102
|
|
Medium
|
306
|
380
|
383
|
707
|
833
|
489
|
786
|
|
Light
|
134
|
31
|
17
|
31
|
34
|
29
|
250
|
|
Total
|
468
|
493
|
666
|
2049
|
2766
|
2048
|
3138
|

Y-O-Y Accumulative Sales Growth of Different Sizes in Jan.-May 2013
|
Length
|
Large
|
Medium
|
Light
|
Whole
|
|
Growth %
|
37.4
|
60.1
|
762.1
|
53.22
|
We can see from the above that:
1. Large growth of new-energy buses per year before 2011 shows the great potential of the market. In Jan.-May 2012, the growth drops 25.9%, while rebounds in Jan.-May 2013, from 15.12% in January to 53.22% in May, which means the end of the recession in 2012. Current condition of new-energy bus market is the recovery is in progress.
Y-O-Y Accumulative Sales Growth in Jan.-May 2013
|
Month
|
Jan.
|
Jan.-Feb.
|
Jan.-March
|
Jan.-April
|
Jan.-May
|
|
Growth %
|
15.12
|
17.61
|
19.03
|
29.38
|
53.22
|
2. In Jan.-May 2013, sales of light buses increase the most, however the growth is insufficient for the whole market due to low base number. Large buses, with the largest sales followed by medium buses, play a key role in the growth of the market.
3. Sales of large buses rank No.1 in the whole market, followed by medium buses and then light buses, however, sales of light buses increase the most, making the most active growth point.
