Summarize:www.chinabuses.org: 1. The overview of the market: the growth has been weak with up and down in every month.
According to sources, sales of luxury buses pricing 0.9 million above in the first half of 2014 is 1566 units, an increase of 2.76% on 2013 of which sales was 1524 units. Compared to the 3.81% in the same period last year, the growth rate narrowed nearly 1.05 which is a sign of weak growth.
|
|
Jan
|
Feb
|
Mar
|
Apr
|
May
|
June
|
Total
|
|
2014
|
288
|
317
|
234
|
227
|
239
|
261
|
1566
|
|
2013
|
301
|
289
|
220
|
211
|
256
|
247
|
1524
|
|
Year on Year Growth %
|
-4.3
|
9.69
|
6.36
|
7.58
|
-6.6
|
5.67
|
2.76
|

Seen from the above table and graph, though the growth of luxury buses in the first half of 2014 is 2.76% in overall, two months of them are negative and four months are positive. The decline of growth in May is the largest and so with the increase of growth in February.It is obvious that the luxury bus market has been unsettled in the first half of 2014.
2. The analysis of luxury bus sales in the first half of the last eight years: the growth regulation of luxury buses pricing 0.9 million to 1.5 million is alike for the last eight years while sales of buses pricing above two million experienced a setback in 2011.
1) Sales of Luxury Buses Pricing above 0.9 Million in 2007 to 2013 and the First Half of Each Year (Unit: unit)
|
Year
|
Jan to
Dec
2007
|
Jan to
Dec
2008
|
Jan to
Dec
2009
|
Jan to
Dec
2010
|
Jan to
Dec
2011
|
Jan to
Dec
2012
|
Jan to
Dec
2013
|
Jan to
Dec
2014
|
|
Unit
|
2086
|
2336
|
2431
|
2889
|
3176
|
3332
|
3305
|
|
|
Year
|
Jan to
Jun
2007
|
Jan to
Jun
2008
|
Jan to
Jun
2009
|
Jan to
Jun
2010
|
Jan to
Jun
2011
|
Jan to
Jun
2012
|
Jan to
Jun
2013
|
Jan to
Jun
2014
|
|
Unit
|
1048
|
1104
|
867
|
1298
|
1375
|
1468
|
1524
|
1566
|
2) Luxury Bus Sales Growth Rate in the First Half Year for the Last 8 Years
|
Year
|
First
Half
2007
|
First
Half
2008
|
First
Half
2009
|
First
Half
2010
|
First
Half
2011
|
First
Half
2012
|
First
Half
2013
|
First
Half
2014
|
|
Growth%
|
12.3
|
5.34
|
-21.47
|
49.71
|
5.93
|
6.76
|
3.81
|
2.76
|

Seen from the above table and graph, from 2007 to 2014, sales of luxury buses pricing above 0.9 million increased from 2086 units to 3305 units. Sales firstly exceeded 2000 units in 2007 reaching 2086 units, then in 2008 reached 2336 units. In 2009, though suffered the impact of financial crisis, sales still grew in a small scale reaching 2889 units in 2010 and 3176 units, 3332 units and 3305 units for 2011, 2012 and 2013 respectively. For sales in the first half years, except 2009, it still saw a upward tend year by year, which consisted with the regulation of the whole year however with a narrowed growth in recent years.
3) Sales of Luxury Buses in Different Price Range in Jan to June from 2009 to 2014(Unit: unit)
|
Price
(yuan)
|
0.9 Million to
1.5 Million
|
1.5 Million to
2 Million
|
2 Million
Above
|
|
Year
|
09
|
10
|
11
|
12
|
13
|
14
|
09
|
10
|
11
|
12
|
13
|
14
|
09
|
10
|
11
|
12
|
13
|
14
|
|
Unit
|
453
|
651
|
711
|
689
|
704
|
729
|
226
|
358
|
389
|
478
|
466
|
489
|
188
|
289
|
275
|
301
|
354
|
348
|
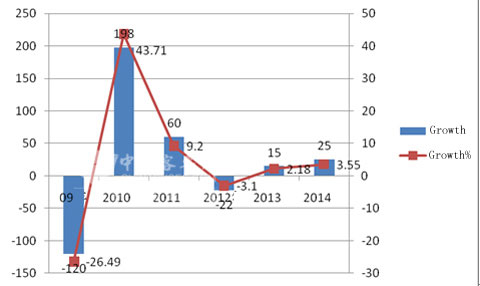
For sales of luxury buses in price range of 0.9 million to 1.5 million in Jan to June from 2009 to 2014, except 2012, other years all saw a growth, of which 2010 saw the largest increase.
The First Half Year's Sales Growth and Growth Rate of Luxury Buses in Price Range of 0.9 Million to 1.5 Million for the Last 5 years
|
Year
|
2009
|
2010
|
2011
|
2012
|
2013
|
2014
|
|
Growth
|
-120
|
198
|
60
|
-22
|
15
|
25
|
|
Growth%
|
-26.49
|
43.71
|
9.2
|
-3.1
|
2.18
|
3.55
|
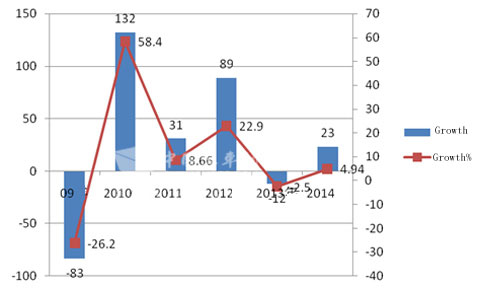
For sales of luxury buses in price range of 1.5 million to 2 million in Jan to June from 2009 to 2014, except 2013, other years all saw a positive growth.
The First Half Year's Sales Growth and Growth Rate of Luxury Buses in Price Range of 1.5 Million to 2 Million for the Last 6 years
|
Year
|
2009
|
2010
|
2011
|
2012
|
2013
|
2014
|
|
Growth
|
-83
|
132
|
31
|
89
|
-12
|
23
|
|
Growth%
|
-26.2
|
58.4
|
8.66
|
22.9
|
-2.5
|
4.94
|
The First Half Year's Sales of Luxury Buses Pricing above 2 million: Sales Growth and Growth Rate of Luxury Buses Pricing above 2 Million for the Last 6 years
|
Year
|
2009
|
2010
|
2011
|
2012
|
2013
|
2014
|
|
Growth
|
-34
|
101
|
-14
|
26
|
53
|
-6
|
|
Growth%
|
-15.3
|
53.7
|
-4.84
|
9.5%
|
17.6
|
-1.69
|

Shown in the above table and graph, for sales of the luxury buses pricing above 2 million in the last 6 years, it did not consist with the growth regulation of the other two price ranges that both 2011 and 2014 saw a decline in sales, which means luxury buses pricing above 2 million experienced a larger market fluctuation.
 editor@chinabuses.org
 86-10-84933192;


