Summarize:www.chinabuses.org: Ⅰ.LNG buses sales area analysis
Conclusion: sales all raised, but concentration decreased.
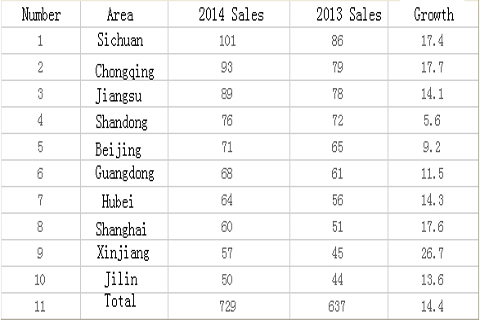
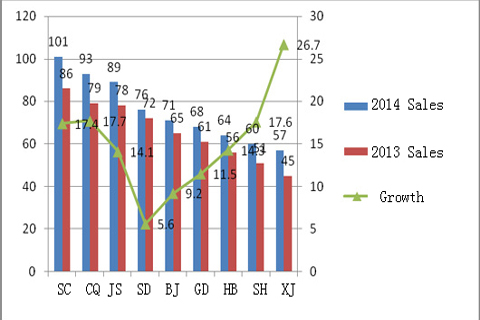
According to the latest registration data statistics, in October 2014, 6 meters and above LNG natural gas bus sales statistics divided by province.


From the chart, in October 2014:
1.Sichuan is the largest sales market of LNG buses, reached 101 units, occupies 12.27% of LNG sales market, concentration fell by 0.83% compared with the same time last year.
2.The sales growth of these areas has been raised in different level; The largest raise is Xinjiang, up 26.7%.
3.Top 10 sales areas sold LNG buses total 729 units, occupied for 88.58% of the market share, and at the same time in 2013 was 97%, it shows that LNG buses distributed unevenly and this trend has signs of abating.
4.Analysis above gave LNG gas buses manufacturers and sales enterprises a basis of marketing strategies and the direction for LNG buses sales areas.
Ⅱ. LNG buses sales structure analysis divided according to the length in October 2014
Conclusion: 11-12m buses have the largest sales; 6-7m buses have the largest growth.
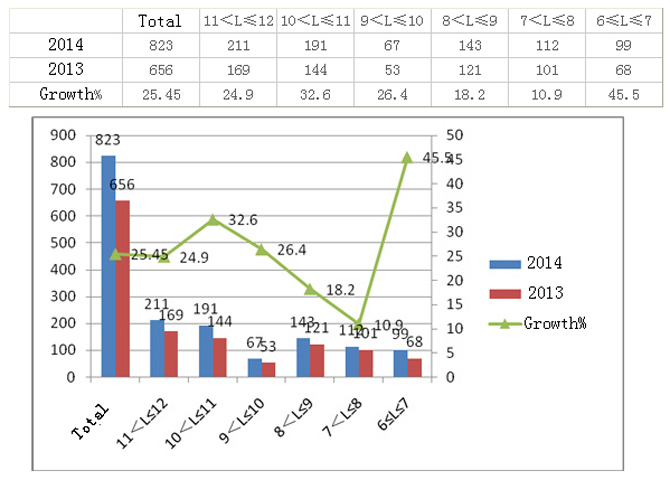
According to the registration data, LNG buses sales statistics.

As can be seen from the chart,
1.In LNG buses market, the biggest selling is 11-12m buses, the largest growth is 6-7m bus
2.Super large section of the LNG buses have no sales, 7-8m buses have the smallest increase.
3.The growth of each period is all positive.
4.LNG buses market growth increase 25.45%, higher than 2014 CNG buses market growth nearly17%, LNG sales growth is obviously higher than CNG sales growth.
Ⅲ. LNG buses sales structure analysis according to the prices.
Conclusion: sales mainly focus in 200000-500000RMB, few are in more than 600000RMB and less than 200000RMB

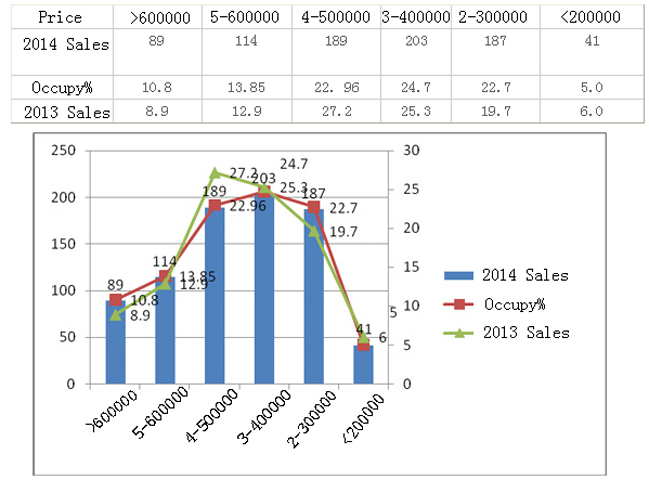
As can be seen from the chart,
1.LNG natural gas buses sold 823 units, only 89 units are more than 600000RMB, occupying 8.9%, but up 1.9% compared with the same time last year, it shows that high level LNG buses market is growing rapidly.
2.The best selling is in 300000-400000RMB, occupying 24.7%, but dropped 0.6% compared with the same time in 2013. According to market research, the price range corresponding to the product mainly are 10-11m buses or 9-10m buses LNG buses, commonly used for public buses. Because the two sections of buses are relatively high cost-effective, both have larger capacity and empty loading rate is relatively low, the rate of return is higher than 11-12m buses and large buses, therefore, this section of LNG buses sold well is reasonable.
3.The buses under 200000RMB are relatively small proportion of LNG buses sales, only 5.0%, and dropped 1% compared with the same time last year, it means that urban and rural bus market paid more and more attention to energy conservation and environmental protection. The price range main products are 6 meters light buses.
4.LNG gas buses market has obvious characteristic according to the price, high prices sold less, either does low prices, this gave bus manufacturing enterprises a basis on pricing strategy, but two sections are relatively increased compare with the same time last year.
5.It is obvious that the section of 400000-500000RMB reduce the range of 4.2% compared with the same time last year; The sections of 200000-300000RMB and more than 600000RMB are increased in different level, but the section of under 200000RMB has a trend of reducing, mainly because of strategy of combining urban and rural cities, energy conservation and environmental protection requirements for 7-8m LNG buses.
6.Higher standard of emission is one of the main reasons causing the high level buses more than 600000RMB and low level buses under 200000RMB to reduce.
Ⅳ. LNG buses sales analysis according to the use.
Conclusion: public buses market is still the main market of LNG buses, than is the passenger transport buses, and the last is group and tourism buses.
LNG market sales statistics according to the use

As can be seen from the chart,
1.Public buses are the main market of LNG buses, occupying 85.7%, but dropped nearly 0.4% compared with the same time last year.
2.Passenger transport buses accounted for 7.3% of LNG buses. The growth is relatively weak (rose by 0.3%), but the base is still small. It means that LNG buses still have a long way to go on highway buses field
3.Group buses occupied 4.86%, increased 0.26% compared with the same time last year.
4.Tourism buses occupied 2.19%, hardly increased compare with the last year. It might because the tourism buses have longer distance than group and school buses, and gas station is less convenient than in the city.
The main reasons for the above phenomenon:
1.Most of the LNG stations are still limited in urban areas, and major public buses running in the urban area, therefore, basic LNG gas concerns were lifted, range can be guaranteed.
2.The extension of LNG city buses market to the highway buses is accelerating.
3.Tourism buses have a smaller market, at the same time, are constrained by the gas stations, so tourism buses market was not able to be the main market of LNG buses.
4.Pure electric and plug-in hybrid new energy buses gradually get into the bus market, squeezed LNG bus market, it can also lead to weak reduce of LNG bus market share.
Ⅴ.The analysis of LNG and CNG buses share in main market

Conclusion: LNG buses is higher than CNG buses in each period
1.LNG buses has their own market in each brand.
2.Yutong Bus in base area Henan LNG buses occupied 34.3%, and the CNG bus market has signs of strengthening.
3.Higer Bus in base area Jiangsu LNG buses occupied 26.7%, is higher than the CNG market share nearly 1.9%.
4.Kinglong Bus in base area Fujian LNG buses occupied 19.1%, is higher than CNG buses share nearly 1.0%.
5.Golden Dragon Bus in base area Guangdong LNG share reached 12.9%, is higher than CNG share nearly 0.9%.
6.Zhongtong Bus in base area Shandong LNG buses market share occupied 28.5%, is higher than CNG share almost 1.4%.
7.Hengtong Bus in base area Chongqing LNG buses market share reached 30.8%, is higher than CNG share nearly 4.7%.
8.Ankai bus in base area Anhui LNG buses market share reached 20.1%, is higher than CNG buses share nearly 3.2%.
Above all, it is obvious that LNG buses share was higher than CNG buses share. Therefore, LNG buses market monopoly degree is higher than CNG buses market monopoly degree.
